


Monday, 13/07/2026, 10:28 (GMT +7)
 1635
1635
International Shipping and Logistics Market Update Week 28/2026 | Phaata
International shipping and logistics market update - Week 28/2026
Table of Contents
-
World Container Index Week 28/2026
-
Asia - North America Ocean Freight Rates
-
Asia - Europe Ocean Freight Rates
-
Northern America - Asia Ocean Freight Rates
-
Northern Europe - Asia Ocean Freight Rates
-
Conclusions and Recommendations by Phaata
1. World Container Index Week 28/2026
Drewry’s World Container Index (WCI) for Week 28/2026 (from July 6 to July 12, 2026) continued its upward trajectory, increasing by 2.4% compared to the previous week to reach $4,639/FEU.
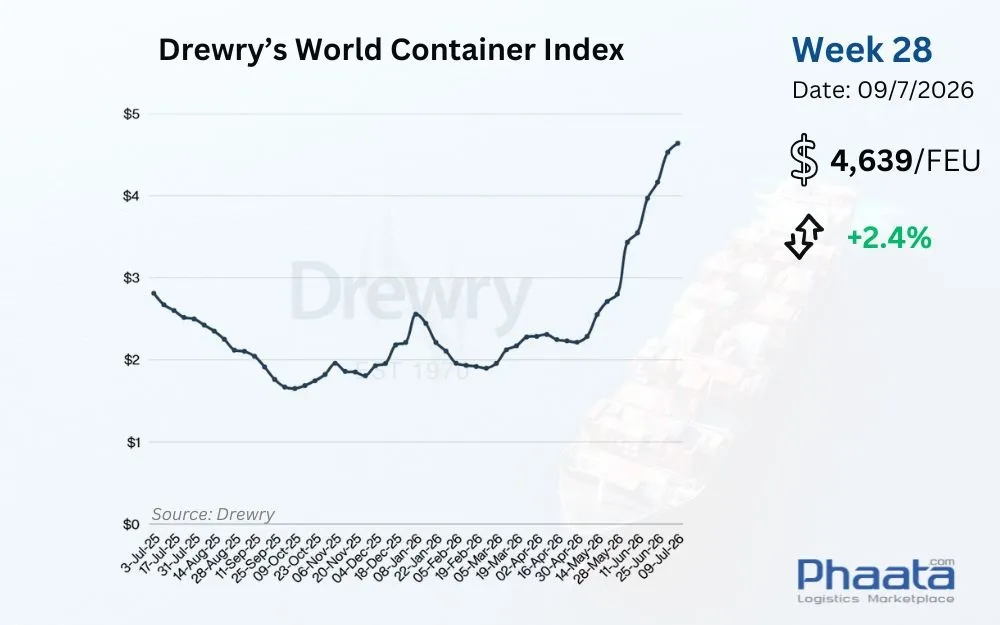
Drewry's World Container Index Week 28/2026 (Photo: Phaata)
2. Asia-North America Ocean Freight Rates
Supply and Demand:
Supply:
-
Operational capacity hits a 3.5-year high: Market data indicates that the total projected capacity deployed in July on the Trans-Pacific Eastbound (TPEB) route is reaching its highest level in approximately three and a half years.
-
Carriers inject additional capacity: The blank sailing ratio continued to drop, falling from around 2% in Week 27 to under 1% in Week 28. This marks one of the lowest levels recorded in the past two months, reflecting carriers' efforts to inject nearly all scheduled capacity into active service.
-
Short-term forecast: Based on current vessel schedules, the blank sailing ratio is expected to remain low from Week 28 to Week 30. Although this figure may rise to roughly 9% in Week 31 (late July), these projections remain fluid as bookings for sailings in this period have not yet been fully finalized.
Demand:
-
Demand outpaces supply growth: Globally, container shipping demand continues to grow at a faster pace than the injection of new vessel capacity.
-
Front-loading trend persists: Many businesses are accelerating their export plans ahead of July 24, the anticipated expiration date for U.S. Section 122 tariff regulations.
-
U.S. import volumes surge: In June, U.S. import container volumes reached approximately 2.25 million TEUs, a 14.3% year-over-year increase. This swelling cargo volume is exerting additional operational pressure on major gateway ports.
Operations:
-
Panama Canal draft limit updates: Effective July 24, the Panama Canal Authority will further adjust draft limits for Neopanamax vessels. To comply, numerous carriers have implemented cargo weight restrictions on routes transiting the canal bound for the U.S. East Coast (USEC) and the Gulf Coast.
-
High rollover risks persist: Localized congestion at select U.S. ports, compounded by the new payload limits through the Panama Canal, continues to elevate the risk of cargo rollovers on services directed to the U.S. East Coast and Gulf Coast.
Rate Developments:
Ocean freight rates from Asia to the U.S. West Coast in Week 28/2026 rose by 5.6% week-on-week, reaching $7,072/FEU. This represents a 66.56% month-on-month increase, according to Xeneta data.
-
Spot rates maintain upward momentum: Intense supply-demand pressure drove benchmark freight indices up by approximately 7% on both the U.S. West Coast and East Coast compared to the previous week. This follows a synchronized General Rate Increase (GRI) implemented by carriers on July 1.
-
Surcharges sustained: Peak Season Surcharges (PSS) remain in effect until July 14. Simultaneously, the Bunker Adjustment Factor (BAF) has been revised upward for the Q3 cycle across the entire TPEB trade lane.
-
Trend forecast: Despite substantial capacity injections, space across many routes remains constrained due to persistently high transport demand. In the short term, this dynamic is highly likely to keep the freight rate baseline elevated throughout July.
Stay tuned to Phaata International Logistics Marketplace for in-depth and fast market updates.
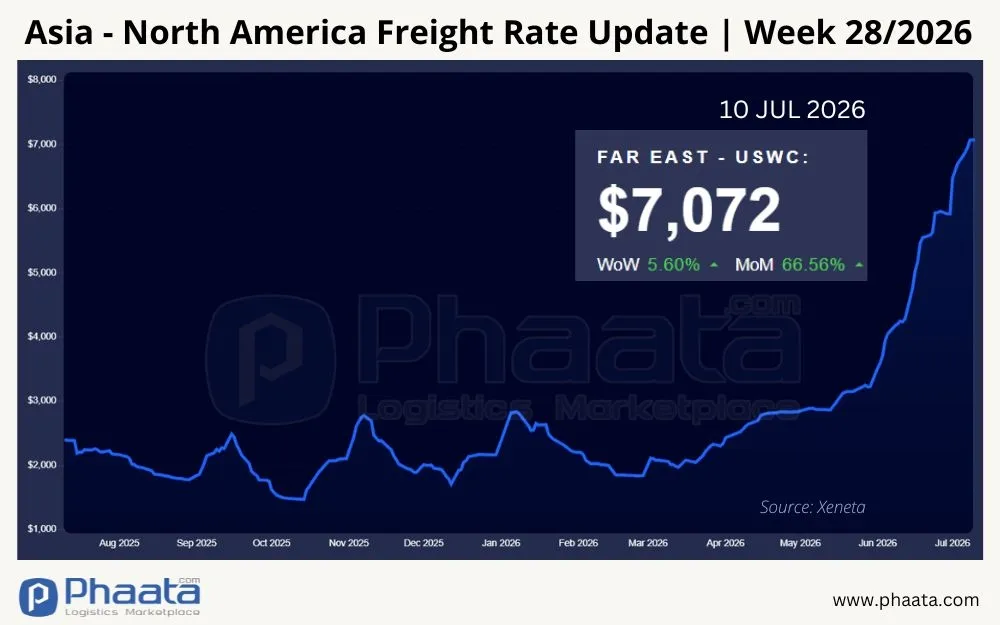
Asia-North America Freight Rates | Week 28/2026 (Photo: Phaata.com)
US Tariff Updates:
1. CPSC Issues Operational Guidelines as eFiling Becomes Mandatory The U.S. Consumer Product Safety Commission (CPSC) has released new operational guidelines clarifying requirements for trade partners and the Product Registry. This guidance coincides with the official implementation of mandatory electronic filing (eFiling) for commodities flagged with CP2 codes.
-
Partner and Testing Lab Data Management:
-
For trade partner data, once an entity is created in a corporate account, the system will reject duplicate records. If information changes, businesses must create a new partner entity rather than editing existing data.
-
For CPSC-accredited testing laboratories, customs filers must not manually enter the lab's name into the Product Registry. Instead, they must select from a pre-populated system list and declare it using a 4-digit CPSC ID.
-
-
Certification Data Requirements:
-
All certification information must be filed in English. The system accommodates supplemental updates to maintain a product’s certification history, or the creation of new certificates for cases unrelated to prior records.
-
The CPSC also noted that the
getImportStatuscommand only reflects the processing status of a file, not the final approval outcome. To look up specific error codes, documentation teams should use thegetImportLogcommand, ideally waiting at least 2 seconds after data submission before querying.
-
-
CP1 and CP2 Code Classification:
-
According to guidance from the National Customs Brokers and Forwarders Association of America (NCBFAA), certification data is mandatory for HTS codes flagged as CP2, and the system will not accept a "disclaim" for these entries.
-
Conversely, for CP1 codes, businesses may still file a disclaim via the Intended Use Code as regulated.
-
-
Compliance Notes:
-
Failing to finalize certification data for CP2 goods may not immediately halt customs clearance, but it will increase the importer's risk score within the CBP system, thereby elevating the likelihood of customs holds or physical exams.
-
Technically, the API currently supports uploading a maximum of roughly 10,000 products per batch, enforces a 5,000-character limit per certificate, and permits a request frequency of 5 requests per second.
-
2. CBP Adjusts Bonded Warehouse Entry Processing on CAPE According to the latest CSMS message, effective July 7, U.S. Customs and Border Protection (CBP) officially ceased accepting customs bonded warehouse entries (Entry Types 21 and 22) via the CAPE system. Files transmitted under these two entry types will be rejected by the system with the error message "ENTRY TYPE NOT ALLOWED."
-
Process for Withdrawal Entries: Bonded warehouse withdrawal entries (Entry Types 31, 32, 34, and 38) continue to be processed normally by CAPE. This is because the IEEPA tax liability is triggered at the time of warehouse withdrawal and is refunded by CBP after the initial warehouse entry is reliquidated.
-
Transition Period Note: For Type 21 and 22 entries submitted to CAPE between April 20 and July 6 without a corresponding withdrawal entry, the system will not process IEEPA refunds. In such cases, businesses must file a new entry accurately reflecting the withdrawal transaction, which dictates when the IEEPA tax was actually paid.
3. U.S. Department of Commerce Initiates Section 232 Review on Anthracite Coal The U.S. Department of Commerce (DOC) confirmed the activation of a Section 232 national security review program covering anthracite coal (HTSUS 2701.11.0000) and metallurgical coal (HTSUS 2701.12.0010).
-
Public Comments: Stakeholders have until July 21 to submit comments. The assessment focuses on: the capacity of the U.S. anthracite industry to meet domestic demand, the feasibility of capacity expansion, the necessity of tariff measures or quotas, impacts from unfair foreign competitive strategies, domestic employment retention, and the risk of export controls applied by other nations.
-
Market Picture from the EIA:
-
According to the U.S. Energy Information Administration (EIA), the U.S. remains a net exporter of coal.
-
In Q1/2026, coal exports reached 23.7 million short tons, vastly outpacing the 737,000 short tons of imports.
-
Metallurgical coal alone recorded an export volume of approximately 13 million short tons, up nearly 5% year-over-year. Key export markets include India, Brazil, Indonesia, and the Netherlands.
-
-
Characteristics of the Anthracite Segment:
-
Anthracite currently accounts for only about 1% of total U.S. coal production, though cumulative output by the end of June increased by approximately 8% year-over-year.
-
The U.S. is also a net exporter of this specific commodity, yet trade scale remains relatively minor, with both annual imports and exports sitting below 1 million short tons.
-
Stay tuned to articles on the Phaata International Logistics Marketplace for rapid and in-depth market updates.
3. Asia-Europe Ocean Freight Rates
Supply and Demand:
Supply:
-
Short-term capacity improvement: The blank sailing ratio on the Far East - Westbound (FEWB) route saw a sharp decline, plummeting from 26% in Week 26 to nearly 0% in Weeks 27 and 28. Carriers reinstating the majority of their scheduled sailings helped alleviate space constraints and reduced booking pressure in the first half of July.
-
Carriers anticipate raising blank sailings: Based on current schedules, the blank sailing ratio on the FEWB route could climb to around 8% in Week 29 and further to 14% by Week 32. However, since bookings for sailings in this window have not been completely filled, operational plans remain subject to adjustment based on actual market developments.
Demand:
-
Transport demand remains high: The market has firmly entered peak season territory, with export demand from Asia to Europe sustaining high levels across most service loops. Fill rates on many sailings remain elevated, particularly for July departures.
-
Red Sea continues to impact operations: Security in the Red Sea region shows little improvement amid ongoing Houthi attacks, the most recent being a July 5 incident off the coast of Yemen (all crew members reported safe). Consequently, the majority of carriers are maintaining the Cape of Good Hope detour. Market data shows the share of Asia-Europe cargo transiting the Suez Canal has plummeted to just 19%, a steep drop from roughly 80% prior to the crisis onset in late 2023.
-
Mediterranean demand climbs: The situation in the Red Sea is driving transport demand to Mediterranean ports at a faster clip than to North Europe. This is reflected in spot rates, with the Shanghai - Genoa route jumping approximately 10% for the week, compared to a 7% week-over-week increase on the Shanghai - Rotterdam route.
Operations:
- Prolonged vessel turnaround times: The majority of carriers continue to favor the Cape of Good Hope routing over the traditional Suez Canal transit. This detour extends transit times by roughly 10–14 days per voyage, slowing down fleet turnaround cycles and heavily impacting the actual operational capacity supplied to the market.
Freight Rate Developments:
Ocean freight rates from Asia to Europe in Week 28/2026 rose by 0.52% week-on-week, reaching $5,457/FEU. This represents a 42.63% month-on-month increase, according to Xeneta data.
-
Surcharges maintained: Peak Season Surcharges (PSS) remain applicable through July 14. Simultaneously, multiple carriers have announced upward adjustments to the Bunker Adjustment Factor (BAF) for the Q3 operational cycle.
-
Rate spread persists: With most carriers still routing via the Cape of Good Hope, spot rates on Asia - Mediterranean routes remain significantly higher than those on Asia - North Europe routes. This rate gap reflects the divergent supply-demand pressures and operational cost disparities between the two regions.
Stay tuned to Phaata International Logistics Marketplace for in-depth and fast market updates.
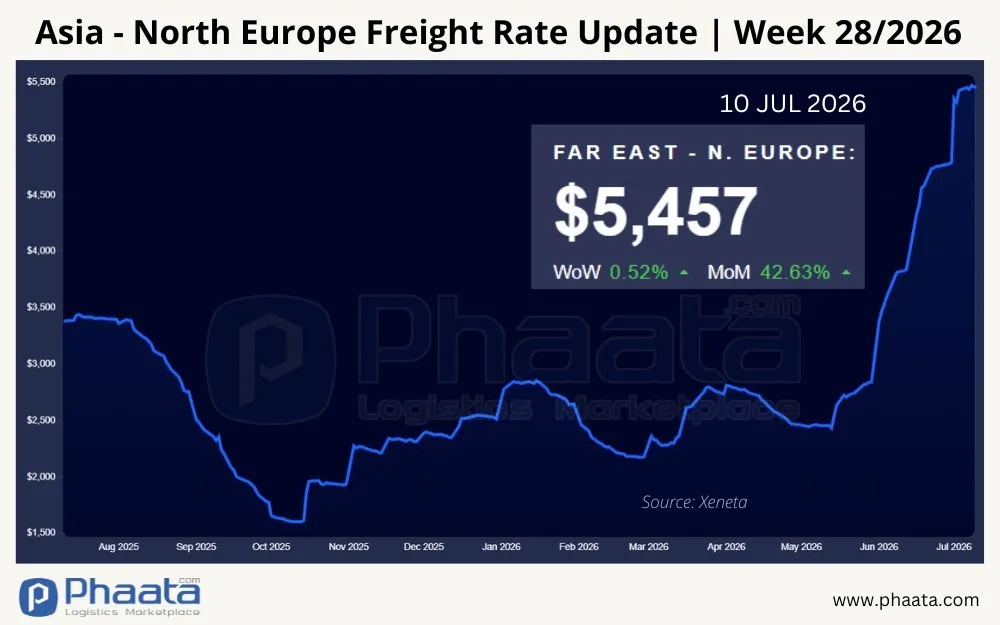
Asia-Europe Freight Rates | Week 28/2026 (Photo: Phaata.com)
4. North America - Asia Ocean Freight Rates
Ocean freight rates from North America (West Coast) to Asia in Week 28/2026 decreased by 2.81% week-on-week, settling at $693/FEU. This rate is up 9.31% month-on-month, according to Xeneta data.
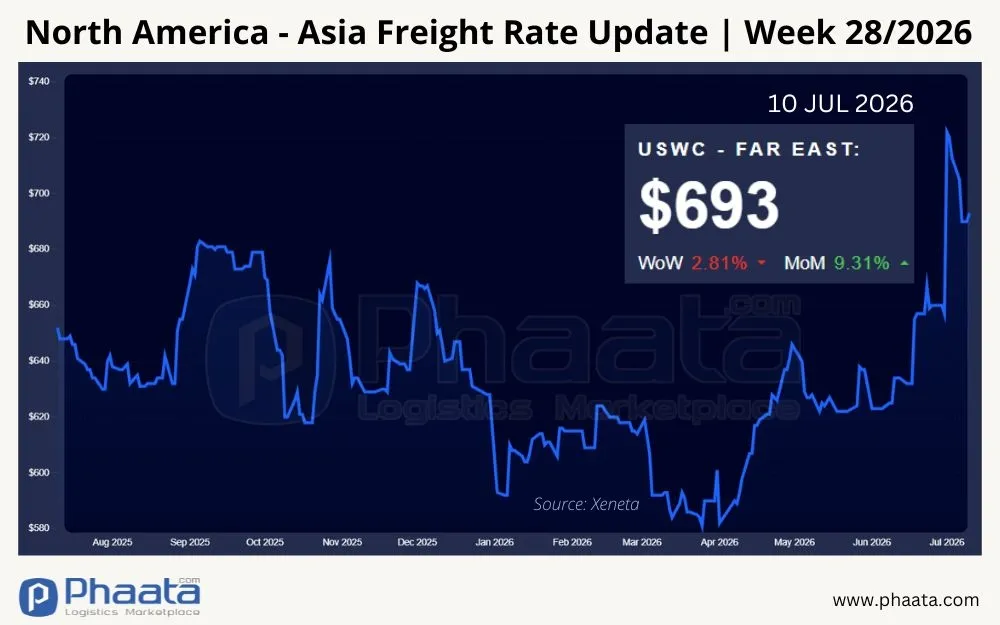
North America (West Coast) - Asia freight rates | Week 28/2026 (Photo: Phaata.com)
5. Northern Europe - Asia Ocean Freight Rates
Ocean freight rates from North Europe to Asia in Week 28/2026 increased by 11.46% week-on-week, reaching $282/FEU. This rate is up 17.50% month-on-month, per Xeneta data.
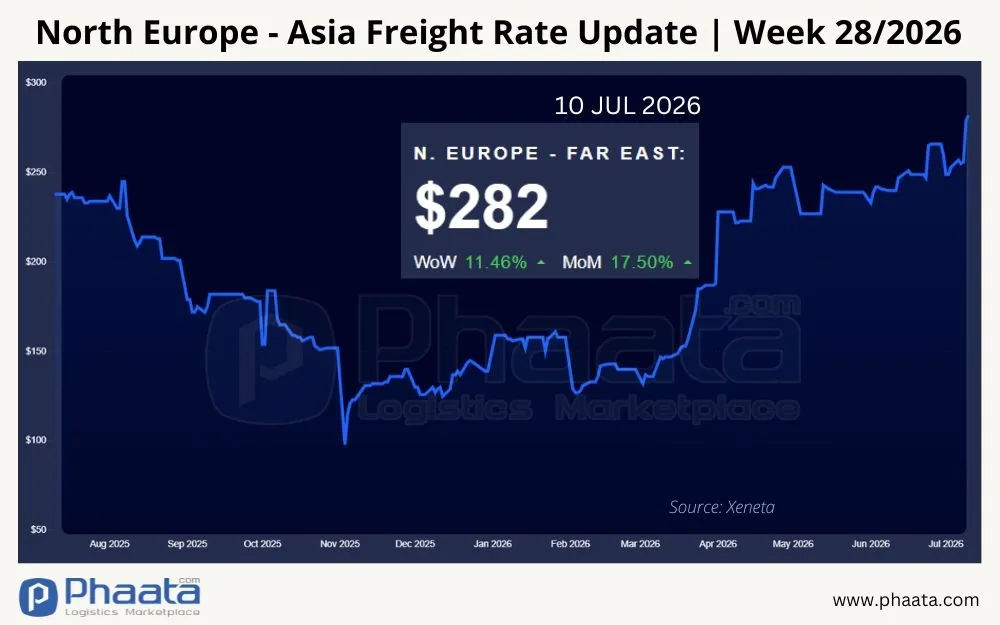
Container Freight rates from Northern Europe to Asia | Week 28/2026 (Photo: Phaata.com)
6. Conclusion and Recommendations from Phaata
The international ocean freight market in Week 28 continues to exhibit an unresolved supply-demand imbalance across key transport corridors. Sustained high transport demand, coupled with operational factors restricting capacity injections, is driving the spot rate baseline further upward. According to Drewry's World Container Index (WCI), global container freight rates climbed an additional 2.4% for the week, hitting $4,639/FEU.
-
Trans-Pacific Eastbound (TPEB): Even as carriers injected additional capacity—pushing the blank sailing ratio below 1% and driving July's total capacity to a 3-plus year high—rates to the U.S. West Coast still surged by approximately 5.6%. This is primarily fueled by a wave of front-loading shipments attempting to beat the expected July 24 expiration of Section 122 tariff regulations. Additionally, the Panama Canal's implementation of new draft limits for Neopanamax vessels is curtailing payload capacity on select routes, elevating rollover risks for cargo destined for the U.S. East Coast and Gulf Coast.
-
Far East - Westbound (FEWB): Capacity supply witnessed only short-term improvements as carriers temporarily reinstated sailing schedules. However, planned increases in blank sailings starting mid-July could tighten supply again by early August. Meanwhile, the persistent Cape of Good Hope detour continues to prolong transit times and degrade fleet operational efficiency. Concurrently, ongoing Red Sea disruptions are driving demand for the Mediterranean region higher than North Europe, thereby sustaining elevated rate baselines on this route.
-
Customs and Compliance Policies: Compliance requirements in the U.S. market continue to tighten. The CPSC's rollout of mandatory eFiling for CP2 goods, combined with CBP halting the processing of certain bonded warehouse entries via the CAPE system, will require businesses to review their declaration workflows and elevate document data quality to mitigate clearance risks.
Recommendations from Phaata
To proactively control logistics costs and maintain supply chain stability, businesses should consider executing the following solutions:
-
Proactive Booking Management: Maintain an advanced booking schedule of 4-6 weeks for North American shipments and 4-5 weeks for European shipments, calculated from the Estimated Time of Departure (ETD). During the peak season, engage early with carriers or logistics providers to confirm space allocations prior to initiating empty container pickup and stuffing plans.
-
Flexible Transport Alternatives: Given the risk of congestion on the U.S. East Coast—stemming from new Panama Canal limits—and the planned capacity cuts on North European routes, businesses should prepare alternative discharge port options. For shipments with stringent delivery timelines, strongly consider utilizing Premium Services to enhance space confirmation guarantees and mitigate rollover risks.
-
Prepare for New Compliance Mandates: Businesses must review eFiling workflows, ensuring certification data is fully and accurately provided in English for CP2 codes prior to transmission to prevent automated system risk assessments. Additionally, reconcile documentation related to bonded warehouse entries to safeguard financial interests and maintain a proactive stance in processing IEEPA tax refunds via CAPE.
Stay tuned to articles on Phaata.com or Phaata fanpage for rapid and in-depth market updates.
Find Freight Rates Here
Find Logistics Companies Here
See more:
- Toward Net Zero: Hapag-Lloyd Expands Shore Power Usage at the Port of Hamburg
- The Maritime Landscape in the Strait of Hormuz Amid New Strategic Adjustments
- COSCO schedules: Vietnam - North America in Jul 2026
- SITC updates Vietnam-Intra Asia sailing schedules in Jul 2026
- Transit Times Cut by Up to 14 Days: Maersk Reinstates MECL Service via Suez Canal
- SHOW INTRODUCTION THE 4TH VIET NAM INTERNATIONAL LOGISTICS EXHIBITION (VILOG 2026)
- Panama Canal Faces Potential Draft Restrictions in 2027
- Air Freight Rates Remain Elevated Despite Gulf Ceasefire Driving Down Jet Fuel Prices
- Hormuz Tensions Escalate: Commercial Vessels Hit by Missiles as U.S.–Iran Talks Stall
- Gemini Cooperation to Trial the Resumption of a Service via the Suez Canal and the Red Sea
Source: Phaata - Where Shippers & Logistics Providers Connect
► Find Better Freight Rates & Logistics Service Providers!


Featured News
- Hapag-Lloyd applies Peak Season Surcharge from East Asia to USA and Canada
- The world\'s largest container ships MSC Irina and MSC Loreto floated
- MSC (Mediterranean Shipping Company) - The world\'s leading container shipping lines
- Information you need to know about Maersk Line
- Top 10 export and import goods between Vietnam - Philippines in the first 5 months of 2020

 Market News
See more
.webp)
.webp)
.webp)
.webp)

 HOT PROMO
See more
805
 FCL
FCL
 12 Days
 Freight cost

Compass Logistics
 Premium
1502
FCL
12 Days
Freight cost
Premium
1502
FCL
12 Days
Freight cost

ASIAN EXPRESS LINE VIETNAM ( AEL VIET NAM )
2550
FCL
6 Days
Freight cost

CÔNG TY CỔ PHẦN TIẾP VẬN INTERCARGO
3367
FCL
5 Days
Freight cost

CÔNG TY TNHH VẬN CHUYỂN QUỐC TẾ N.B.L
4015
FCL
20 Days
Freight cost

N.B.L INTERNATIONAL TRANSPORT CO., LTD
Why do thousands of businesses trust Phaata?
USERS/MONTH
LOGISTICS COMPANIES
REQUEST FOR QUOTEŚ
QUOTATIONS
VIETNAM LOGISTICS COMMUNITY
5 Steps to Get the Best Quote
Find a price quickly/Send a RFQ
Compare multiple options
Contact for Further Consultation
Negotiating prices/services
Management & rating
 Freight rates
Sea freight
- FCL
See more
17
131
3
Days Direct
- ₫9,262,050 / 20'GP
- ₫19,847,250 / 40'GP
- ₫19,847,250 / 40'HQ
- ₫19,847,250 / 45'HQ

NP LOGISTICS CO.,LTD
402
8
Days Direct
- ₫38,106,720 / 20'GP
- ₫39,429,870 / 40'GP
- ₫38,106,720 / 40'HQ

GIA LINH LOGISTICS SERVICES CO., LTD. (G LINK Logistics)
1,068
14
Days Transit
- ₫4,366,395 / 20'GP
- ₫9,658,995 / 40'HQ

CÔNG TY TNHH GIAO NHẬN TOÀN CẦU GS
1,528
37
Days Transit
- ₫70,920,840 / 20'GP
- ₫104,396,535 / 40'GP
- ₫104,396,535 / 40'HQ

Công Ty TNHH Quanterm Logistics Vietnam
Sea freight
- LCL
See more
2,159
 3,083
5
Days Direct
3,083
5
Days Direct
- ₫26,463 /cbm

CÔNG TY TNHH T&M FORWARDING - CHI NHÁNH HÀ NỘI
4,371
3
Days Direct
- Refund ₫926,205 /cbm

CÔNG TY CỔ PHẦN GIAO NHẬN VẬN TẢI HỒNG SƠN
4,852
4,123
3
Days Direct
- ₫132,315 /cbm

CÔNG TY TRÁCH NHIỆM HỮU HẠN DT LOGISTICS (VN)
 Air freight
- General cargo
Air freight
- General cargo
See more
5,097
1
Days Direct
- 46,310 ₫/kg
N.B.L INTERNATIONAL TRANSPORT CO., LTD
6,666
1
Days Direct
- 161,424 ₫/kg
CÔNG TY CỔ PHẦN GIAO NHẬN VẬN TẢI HỒNG SƠN
9,183
10
Days Transit
- 264,630 ₫/kg

Phoenix Logistics Vietnam - chi nhánh TP. Hồ Chí Minh (Phoenix International Forwarding Vietnam )
10,729
1
Days Direct
- 185,241 ₫/kg

CÔNG TY TNHH THƯƠNG MẠI VÀ DỊCH VỤ FASTRANS
9,755

 Rail freight
- FCL
Rail freight
- FCL
See more
6,435
5
Days Direct
- ₫44,987,100 / 40'HQ
- ₫44,987,100 / 45'HQ

CÔNG TY TNHH PHƯỚC TÁ
9,042
3
Days Direct
- ₫15,083,910 / 40'HQ

CÔNG TY CỔ PHẦN VẬN TẢI VÀ THƯƠNG MẠI ĐƯỜNG SẮT
18,973
7
Days Direct
- ₫48,956,550 / 20'GP

Công ty TNHH T&M Forwarding
17,591
5
Days Direct
- ₫7,145,010 / 20'GP
ASIAN EXPRESS LINE VIETNAM ( AEL VIET NAM )
10,685
10
Days Direct
- ₫9,262,050 / 20'GP

CÔNG TY CỔ PHẦN LOGISTICS QUỐC TẾ V&T
 Road freight
- FCL
Road freight
- FCL
See more
2,344
 9,383
1
Day
9,383
1
Day
- ₫28,000,000 / 20'GP
- ₫28,000,000 / 40'GP

CÔNG TY TNHH THƯƠNG MẠI DỊCH VỤ VÀ KHO VẬN VIETTEL POST - TTC
110,291
2
Day
- ₫6,500,000 / 40'RF
- ₫6,500,000 / 40'RQ
- ₫6,500,000 / 45'RQ

CÔNG TY CP PROSHIP
Premium
178,708
1
Day
- ₫18,997,200 / 20'GP
- ₫18,997,200 / 40'GP

CÔNG TY CỔ PHẦN GIAO NHẬN VẬN TẢI CON ONG
266,449
3
Day
- ₫32,000,000 / 20'GP
- ₫64,000,000 / 40'GP
- ₫64,000,000 / 40'HQ
- ₫64,000,000 / 45'HQ

Công ty Cổ phần phát triển thương mại Thuận Đạt Việt Nam


