

Thursday, 17/09/2026, 10:37 (GMT +7)
 251
251
US Container Imports Reach 2.6 Million TEU, Third-Highest Volume on Record
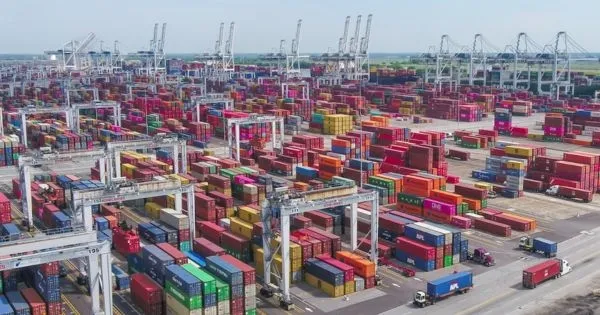
Port of Savannah
US container imports increased 3.8% from July to 2,603,709 TEU in August, making the monthly volume the third-highest on record.
According to Descartes Datamyne data, the August volume was surpassed only by those recorded in May 2022 and July 2025. Compared with August 2019, before the COVID-19 pandemic, US container imports in August 2026 were 21.5% higher.
The increase was recorded across several major container gateways on the East Coast, Gulf Coast and West Coast, while importers continued to monitor port handling capacity, trade policies and other factors that could affect shipping schedules.
Major Ports Record Higher Volumes
The 10 largest container ports in the US handled 84.6% of total container import volumes in August. Of these, eight recorded higher volumes than in the previous month.
Savannah posted a 9.2% increase, followed by New York/Newark at 7.2% and Long Beach at 2.8%.
The increases at New York/Newark and Savannah helped raise the combined market share of East Coast and Gulf Coast ports to 40.7%, up from 39.8% in July. Meanwhile, the market share of West Coast ports edged down to 43.9%.
Higher volumes were also accompanied by longer delays across all 10 major ports. Houston and Seattle recorded the largest increases, with delays extending by 1.5 days, while Savannah saw delays increase by 1.3 days.
For shippers and logistics service providers, developments in cargo volumes and port processing times are important factors to consider when planning cargo deliveries and collections, particularly for time-sensitive shipments.
Volumes from Multiple Export Markets Continue to Rise
The increase in August imports was recorded across several key export markets.
Container volumes from China rose 1.3% from the previous month to 884,318 TEU. However, China’s share of total US container imports fell to 34%, as some other sourcing markets grew at a faster pace.
Vietnam added 14,545 TEU, equivalent to a 5.2% increase. Thailand and Indonesia also recorded increases of 10.4% and 19.5%, respectively.
These developments indicate that US import cargo continues to be sourced from a broader range of export markets. For businesses, changes in sourcing patterns may lead to adjustments in shipping routes, port selection and inland transportation arrangements.
Geopolitical and Trade Factors Continue to Affect Supply Chains
The increase in import volumes comes as shippers continue to manage multiple factors that could affect supply chain costs and reliability.
● Geopolitical risks: Developments surrounding the Strait of Hormuz and the security situation in the Red Sea remain factors to monitor for relevant shipping routes. Changes in vessel routing can affect transit times and logistics costs.
● Tariffs: US tariff policies under Section 301 and Section 232 require importers to assess their impact on landed costs based on individual products, countries of origin and HS codes. Calculating total costs therefore involves more than freight rates alone.
● Panama Canal: Transit capacity through the Panama Canal remains a factor to monitor for ocean services to the East Coast and Gulf Coast. According to the Panama Canal Authority (ACP), 9 Neopanamax vessel transits per day are allocated, while Panamax vessels are allocated 23 transits per day during the applicable period.
For all-water services to the East Coast and Gulf Coast, constraints on transit capacity could affect waiting times and vessel schedules, depending on each carrier’s operating plans.
Rising Container Volumes Add Pressure on Handling Capacity
US imports of more than 2.6 million TEU in August show that cargo flows into the US market continue to run at high levels compared with the pre-pandemic period. However, elevated volumes also place additional demands on port receiving and handling capacity, inland transportation and logistics services beyond the port.
Against this backdrop, importers need to monitor volumes at major gateways, port processing times, inland transportation capacity and changes in trade policies simultaneously.
For shipments with tight delivery windows, assessing port options, service routes and inland transportation alternatives in advance can give businesses greater flexibility as operating conditions change.
The August data show that demand for container imports into the US remains high, while the stable operation of supply chains continues to depend on port handling capacity, the reliability of transportation networks and changes in the international trade environment.
See more:
- Prolonged Gulf Crisis Raises Biofouling Risks for Idled Vessels
- SITC – CONNECTING CAMBODIA WITH VIETNAM AND THE WORLD
- COSCO Shipping Heavy Industry Begins A-Share Listing Process in Shanghai
- International Shipping and Logistics Market Update Week 37/2026 | Phaata
- US-Iran Conflict Puts Growing Pressure on Maritime Operations in the Strait of Hormuz
- 18 Maritime Nations Warn of a “Structural Shift” in Global Trade
- Rotterdam World Gateway Completes €500 Million Financing for Expansion Project
- Maersk Updates PSS for Mediterranean–North America Trade
- Hapag-Lloyd and FIMI Given 30 More Days to Restructure ZIM Deal
- International Shipping and Logistics Market Update Week 36/2026 | Phaata
- Maersk and ONE Hike Environmental Surcharges on Asia–Europe Trades Effective October 2026
- German Seaports: Over 6,000 Port Workers Reject ZDS's 5.1% Wage Offer; Threat of Fresh Strikes Remains on the Table
- Port Strike in the Netherlands on September 4: Rotterdam Could Face Nearly Eight Hours of Disrupted Vessel Handling
- COSCO schedules: Vietnam - North America in Sep 2026
- SITC updates Vietnam-Intra Asia sailing schedules in Sep 2026
Source: Phaata.com (According to Freight Waves)
► Find Better Freight Rates & Logistics Service Providers!


Featured News
- Hapag-Lloyd applies Peak Season Surcharge from East Asia to USA and Canada
- The world\'s largest container ships MSC Irina and MSC Loreto floated
- MSC (Mediterranean Shipping Company) - The world\'s leading container shipping lines
- Information you need to know about Maersk Line
- Top 10 export and import goods between Vietnam - Philippines in the first 5 months of 2020

 Market News
See more
.webp)

.webp)
_(4).webp)

 HOT PROMO
See more
147
 FCL
FCL
 6 Days
 Freight cost

N.B.L INTERNATIONAL TRANSPORT CO., LTD
403
FCL
30 Days
Freight cost

AIR TIGER EXPRESS LOGISTICS
877
FCL
23 Days
Freight cost

CÔNG TY TNHH TIẾP VẬN TOÀN CẦU KM
1079
FCL
40 Days
Freight cost

CÔNG TY TNHH VẬN TẢI VÀ TIẾP VẬN TOÀN CẦU
1123
FCL
45 Days
Freight cost

Compass Logistics
 Premium
Why do thousands of businesses trust Phaata?
USERS/MONTH
LOGISTICS COMPANIES
REQUEST FOR QUOTEŚ
QUOTATIONS
VIETNAM LOGISTICS COMMUNITY
5 Steps to Get the Best Quote
Find a price quickly/Send a RFQ
Compare multiple options
Contact for Further Consultation
Negotiating prices/services
Management & rating
 Freight rates
Sea freight
- FCL
See more
35
30
Days Transit
- ₫140,253,900 / 20'GP

CÔNG TY CỔ PHẦN GIAO NHẬN VẬN TẢI HỒNG SƠN
74
25
Days Direct
- ₫150,839,100 / 20'GP
- ₫205,088,250 / 40'GP
- ₫205,088,250 / 40'HQ

OPL LOGISTICS
96
30
Days Transit
- ₫76,742,700 / 20'GP
- ₫83,358,450 / 40'GP
- ₫83,358,450 / 40'HQ
N.B.L INTERNATIONAL TRANSPORT CO., LTD
130
36
Days Direct
- ₫163,594,266 / 20'GP

CHI NHÁNH THÀNH PHỒ HỒ CHÍ MINH - CÔNG TY TNHH HECNY SHIPPING VIỆT NAM
136
40
Days Transit
- ₫258,014,250 / 40'HQ

CÔNG TY TRÁCH NHIỆM HỮU HẠN DT LOGISTICS (VN)
Sea freight
- LCL
See more
419
4
Days Direct
- ₫0 /cbm
CÔNG TY CỔ PHẦN GIAO NHẬN VẬN TẢI HỒNG SƠN
651
5
Days Direct
- ₫0 /cbm
CÔNG TY TRÁCH NHIỆM HỮU HẠN DT LOGISTICS (VN)
1,115
6
Days Direct
- ₫523,180 /cbm
CÔNG TY TNHH VẬN TẢI VÀ TIẾP VẬN TOÀN CẦU
1,423
1,252
4
Days Direct
- ₫396,945 /cbm
CHI NHÁNH THÀNH PHỒ HỒ CHÍ MINH - CÔNG TY TNHH HECNY SHIPPING VIỆT NAM
 Air freight
- General cargo
Air freight
- General cargo
See more
2,883
10
Days Transit
- 264,630 ₫/kg

Phoenix Logistics Vietnam - chi nhánh TP. Hồ Chí Minh (Phoenix International Forwarding Vietnam )
4,643
1
Days Direct
- 185,241 ₫/kg

CÔNG TY TNHH THƯƠNG MẠI VÀ DỊCH VỤ FASTRANS
7,767
 7,166
8
Days Transit
7,166
8
Days Transit
- 224,936 ₫/kg

CÔNG TY TNHH SEA GLOBAL VIỆT NAM
3,857
1
Days Direct
- 502,797 ₫/kg

CÔNG TY TNHH VẬN TẢI QUỐC TẾ GIA PHÚ
 Rail freight
- FCL
Rail freight
- FCL
See more
1,196
5
Days Direct
- ₫44,987,100 / 40'HQ
- ₫44,987,100 / 45'HQ

CÔNG TY TNHH PHƯỚC TÁ
2,186
3
Days Direct
- ₫15,083,910 / 40'HQ

CÔNG TY CỔ PHẦN VẬN TẢI VÀ THƯƠNG MẠI ĐƯỜNG SẮT
12,866
7
Days Direct
- ₫48,956,550 / 20'GP

Công ty TNHH T&M Forwarding
11,873
5
Days Direct
- ₫7,145,010 / 20'GP

ASIAN EXPRESS LINE VIETNAM ( AEL VIET NAM )
9,149
10
Days Direct
- ₫9,262,050 / 20'GP

CÔNG TY CỔ PHẦN LOGISTICS QUỐC TẾ V&T
 Road freight
- FCL
Road freight
- FCL
See more
1,232
1
Day
- ₫28,000,000 / 20'GP
- ₫28,000,000 / 40'GP

CÔNG TY TNHH THƯƠNG MẠI DỊCH VỤ VÀ KHO VẬN VIETTEL POST - TTC
2,419
4
Day
- ₫211,704 / 20'GP

CÔNG TY CỔ PHẦN KINH DOANH THƯƠNG MẠI VÀ DỊCH VỤ HỎA TỐC
45,469
1
Day
- ₫6,868,686 / 20'OT
- ₫6,868,686 / 40'OT
- ₫6,868,686 / 40'OT HQ

CÔNG TY TNHH LIÊN VẬN QUỐC TẾ SHINING OCEAN VIỆT NAM
102,993
2
Day
- ₫6,500,000 / 40'RF
- ₫6,500,000 / 40'RQ
- ₫6,500,000 / 45'RQ

CÔNG TY CP PROSHIP
Premium
172,499
1
Day
- ₫18,997,200 / 20'GP
- ₫18,997,200 / 40'GP

CÔNG TY CỔ PHẦN GIAO NHẬN VẬN TẢI CON ONG


