


Monday, 15/06/2026, 06:00 (GMT +7)
 1060
1060
International Shipping and Logistics Market Update Week 24/2026 | Phaata

International shipping and logistics market update - Week 24/2026
Table of Contents
-
World Container Index Week 24/2026
-
Asia - North America Ocean Freight Rates
-
Asia - Europe Ocean Freight Rates
-
Northern America - Asia Ocean Freight Rates
-
Northern Europe - Asia Ocean Freight Rates
-
Conclusions and Recommendations by Phaata
1. World Container Index Week 24/2026
Drewry’s World Container Index (WCI) for Week 24/2026 (from June 8 to June 14, 2026) continued its upward trend, increasing by 3.38% compared to the previous week, reaching $3,549/FEU.
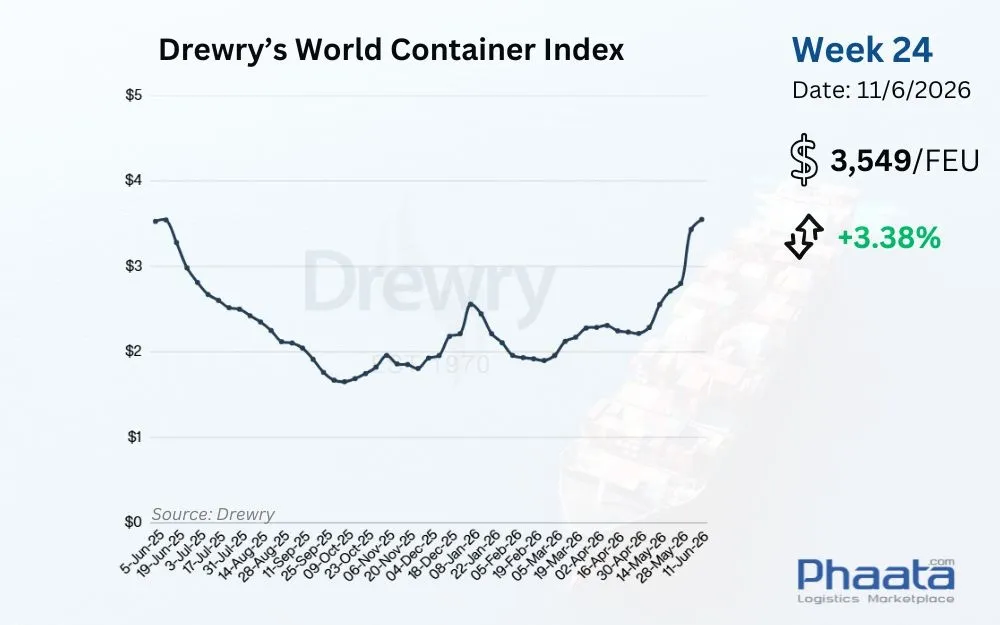
Drewry's World Container Index Week 24/2026 (Photo: Phaata)
2. Asia-North America Ocean Freight Rates
Supply and Demand:
Peak Season Capacity Control: Carriers are currently maintaining a rather strict capacity management strategy. Capacity regulation via blank sailings is heavily concentrated on the Trans-Pacific Eastbound (TPEB) route, accounting for approximately 50% of all canceled sailings across the entire East-West trade network over the next 5 weeks (even though the average blank sailing ratio across the whole network is only around 5%).
Shrinking Space and Panama Canal Caveats: Space across the Pacific Southwest (PSW), Pacific Northwest (PNW), and U.S. East Coast (USEC) gateways is currently being allocated and filled very rapidly. Cargo rollovers are trending upward as booking acceptance windows tighten. Notably, the Panama Canal Authority expects to reduce the maximum authorized draft at the Neopanamax locks from 50 feet to 49.5 feet starting July 1. This adjustment will have a direct impact, reducing the payload capacity of vessels bound for the U.S. East Coast.
Front-loading Trend: This year's peak shipping season has arrived earlier than its usual cycle. This shift primarily stems from two factors: (1) Shippers are accelerating export schedules to mitigate risks from impending U.S. tariff adjustments anticipated in July; and (2) Increased cargo circulation demand serving the 2026 World Cup. This wave has significantly shortened cargo preparation lead times and filled the majority of space on June sailings.
Rate Developments:
Ocean freight rates from Asia to the North America West Coast in Week 24/2026 increased by 5.93% week-on-week, reaching $4,287/FEU. This rate is up 49.58% month-on-month, according to Xeneta data.
Establishing a New Rate Baseline: The Shanghai Containerized Freight Index (SCFI) in Week 23 (ending June 7) recorded significant jumps, approximately 30% for West Coast routes and 20% for the East Coast compared to the previous week. Other benchmark indices in the market reflect a similar trend.
Synchronized Surcharge Rollouts: Starting June 1, carriers implemented General Rate Increases (GRIs) across all gateways, accompanied by Peak Season Surcharges (PSS) and adjustments to the Emergency Bunker Surcharge (EBS).
Forecast: The latest reference data suggests the SCFI is likely to climb by roughly another 10% on both coasts. This indicates that the freight rate baseline and surcharge structure established at the beginning of June are being absorbed by the market and maintained relatively stably.
Stay tuned to Phaata International Logistics Marketplace for in-depth and fast market updates.
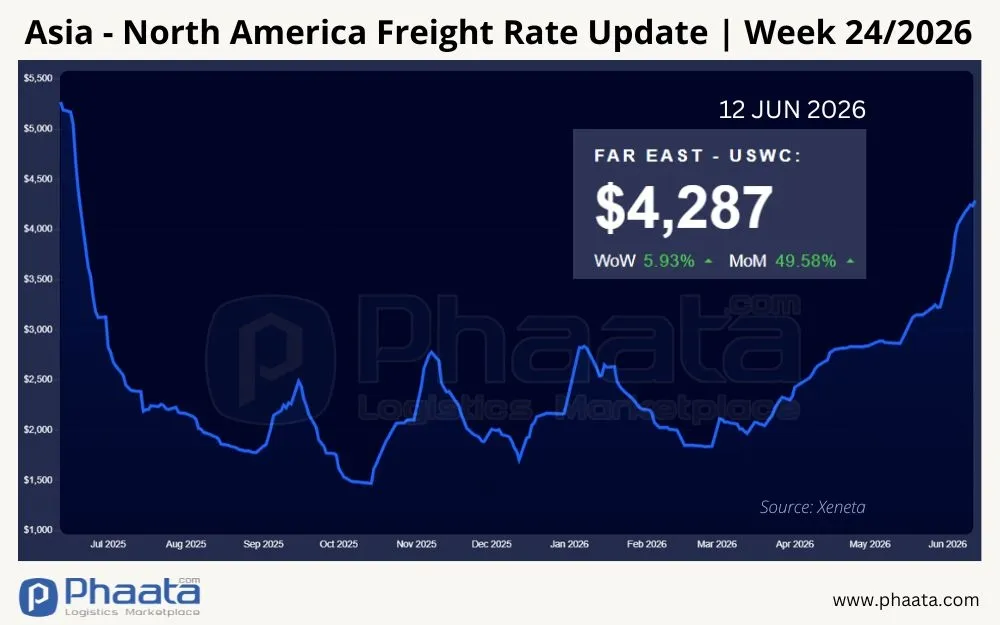
Asia-North America Freight Rates | Week 24/2026 (Photo: Phaata.com)
US Tariff Updates:
1. CAPE Refund System Progress and IEEPA Cash Flow Management Notes
The June 9 hearing at the Court of International Trade (CIT) provided clearer insight into the CAPE refund progress and alerted businesses regarding wait times for older entry groups.
-
CAPE System Roadmap Update:
-
Phase 2 (Expected June 29): The system plans to open a dedicated processing portal for reconciliation entries.
-
Phase 3 (Expected late July): Rollout for processing finally liquidated entries (entries past 90 days from their liquidation date).
-
-
Legal Hurdles: On May 29, the Department of Justice (DOJ) filed an appeal with the Federal Court of Appeals regarding the CIT's ruling. The government argues that Customs and Border Protection (CBP) lacks the authority to automatically issue refunds for finally liquidated entries without a court order for each specific importer.
-
Impact on Disbursement Timelines: Although CBP continues to process refunds for unliquidated entries while the appeal is pending, the resolution process at the Court of Appeals could drag on for several more months.
-
Recommendation for Documentation Departments: For finally liquidated entries, businesses should not assume CAPE (Phase 3) will automatically disburse funds. Importers should proactively work with their customs brokers and legal counsel to consider protest options at the CIT, thereby maximizing the protection of their financial rights.
2. USMCA Negotiation Progress and Proposed Rules of Origin (ROO) Adjustments
The USMCA review process will likely be extended past the July 1, 2026 milestone. Experts forecast the U.S. may reach an agreement with Mexico this fall, while discussions with Canada could stretch into 2027.
-
Proposals to Tighten ROO: During the first round of negotiations with Mexico, the U.S. shared draft ROO adjustments for the automotive, electronics, steel, and aluminum sectors. Notably, the U.S. proposes raising the North American localized content ratio for the vehicle group to 82% (up from the current 75%), coupled with a requirement for 50% net U.S. origin value content.
-
Global Supply Chain Orientation: A parallel objective of adjusting ROO (especially in semiconductors and electronics) is to strictly control the percentage of components from third countries benefiting via origin transformation. However, a bright spot is that USMCA-compliant goods are currently exempt from the new Section 301 tariff lists, helping businesses within the bloc maintain their cost competitiveness.
3. Section 301 Tariff Progress Update and Legal Framework Notes
-
Potential Implementation Delay: The July 24 target date for imposing new retaliatory tariffs (including 20% on Vietnamese goods and 30% on South African goods) will likely require more time. The USTR's investigation report is still in the finalization stage and will need approximately one more month for public comment before official issuance.
-
Stable Base Tariff Structure: Given that the market has accustomed itself to base tariffs ranging from 10% to 12.5%, experts assess that the new tariff implementation process will not cause an immediate shock and may be smoothly finalized by "late summer."
-
Expert Perspectives: The legal foundation of the Section 301 reports is being closely scrutinized by trade lawyers. Petitions to review the rationale of these tariffs may emerge in the future. Businesses should consistently monitor news updates to promptly adjust their Landed Cost structures as needed.
Stay tuned to articles on the Phaata International Logistics Marketplace for rapid and in-depth market updates.
3. Asia-Europe Ocean Freight Rates
Supply and Demand:
Impact of the Cape of Good Hope Detour: Due to ongoing security risks in the Red Sea region, the vast majority of carriers prioritize maintaining the detour around the Cape of Good Hope over transiting the Suez Canal (with a few voyage exceptions). Prolonging this turnaround cycle has relatively depleted the total weekly available capacity in the market.
Capacity Control Pressure: The blank sailing ratio on the Asia-Europe and Mediterranean routes currently accounts for roughly 1/3 of total blank sailing orders across the entire East-West trade axis over the next 5 weeks, keeping space allocation tightly controlled.
Early Peak Season Shift: Cargo volumes on the Asia-Europe route in Q1/2026 jumped approximately 15% year-on-year, and this growth momentum is holding steady in June. The confluence of the Red Sea crisis impact, an earlier summer import cycle, and the front-loading trend to dodge July rate hikes has significantly narrowed the booking acceptance window.
Operations:
The supply-demand imbalance is becoming pronounced. Carriers recording bookings exceeding actual capacity (overbooking) means June sailings possess virtually no buffer space. The risk of cargo rollovers is trending upward, accompanied by emerging empty container shortages recorded at several key export ports in China.
Freight Rate Developments:
Ocean freight rates from Asia to Europe in Week 24/2026 increased by 5.35% week-on-week, reaching $3,843/FEU. This rate is up 56.35% month-on-month, according to Xeneta data.
Spot Rate Momentum: The Shanghai Containerized Freight Index (SCFI) recorded its 6th consecutive week of recovery; however, the pace of the increase is showing signs of easing. Specifically, the North Europe route jumped about $570 in Week 23, but the increase margin narrowed to only about $130 in Week 24.
Signs of Stabilization in the Mediterranean: Following an upward adjustment of roughly 20% in Week 23, forecast data indicates Mediterranean route rates are moving sideways in Week 24. This is a fairly positive signal suggesting the rate baseline in this region may be beginning to establish a new stable threshold.
Surcharge Adjustment Trends: Carriers have filed plans to update surcharges on the Asia-Europe route, expected to take effect from mid-June. Coupled with the re-establishment of the Bunker Adjustment Factor (BAF) in July and rigorous capacity management strategies, total ocean freight costs are forecast to remain anchored at high levels. Overall, current market conditions are still operating under carrier-dictated pricing.
Stay tuned to Phaata International Logistics Marketplace for in-depth and fast market updates.
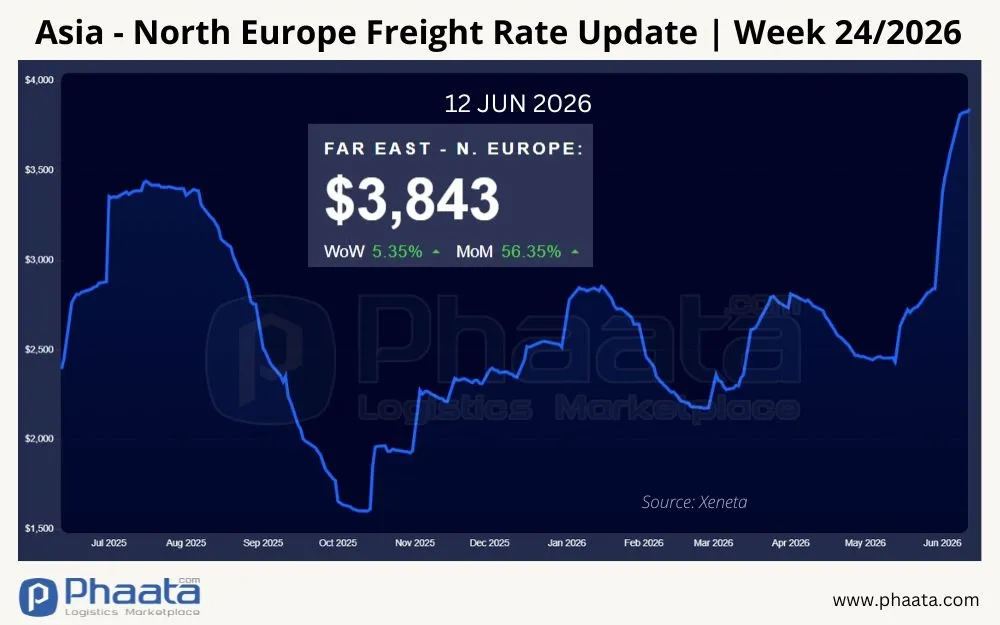
Asia-Europe Freight Rates | Week 24/2026 (Photo: Phaata.com)
4. North America - Asia Ocean Freight Rates
Ocean freight rates from North America (West Coast) to Asia in Week 24/2026 increased by 1.77% week-on-week, settling at $634/FEU. This rate is up 1.44% month-on-month, according to Xeneta data.
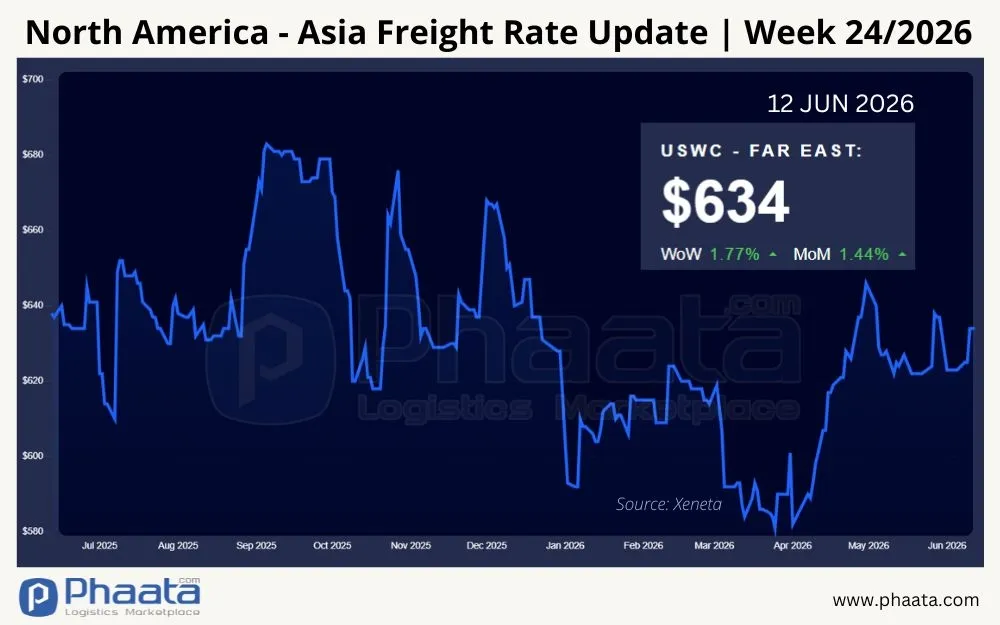
North America (West Coast) - Asia freight rates | Week 24/2026 (Photo: Phaata.com)
5. Northern Europe - Asia Ocean Freight Rates
Ocean freight rates from North Europe to Asia in Week 24/2026 increased by 2.49% week-on-week, reaching $247/FEU. This rate is up 8.81% month-on-month, per Xeneta data.
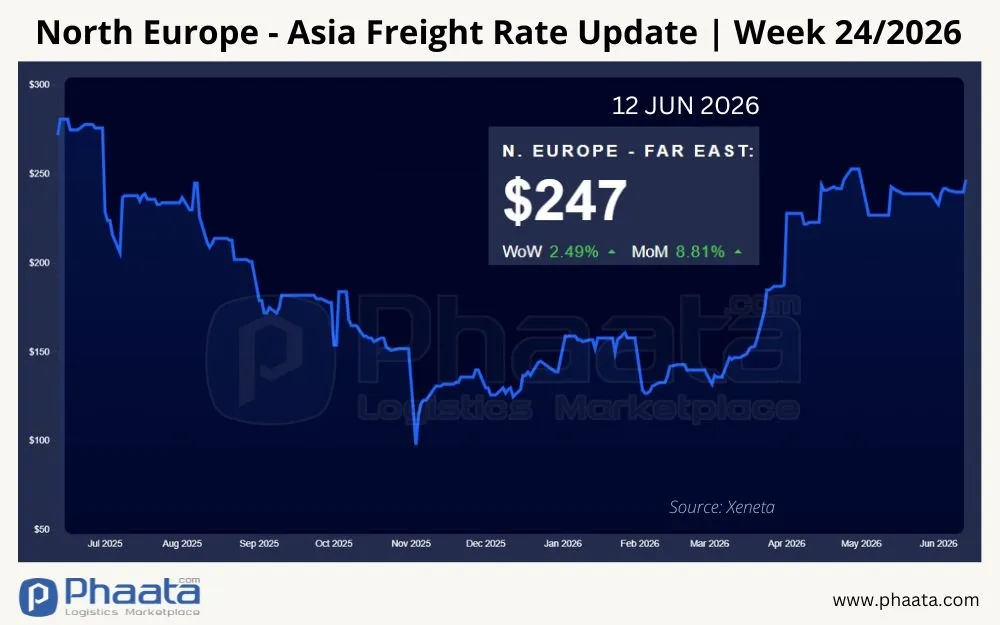
Container Freight rates from Northern Europe to Asia | Week 24/2026 (Photo: Phaata.com)
6. Conclusion and Recommendations from Phaata
The international logistics market in Week 24/2026 continues to operate under the influence of an "Early Peak Season," characterized by supply-demand imbalances and latent risks concerning tariff policies:
Operational Capacity Reaching Critical Limits: The WCI index continued its ascent by 3.38%. Across both major trade axes (Trans-Pacific and Far East-North Europe), capacity supply is facing massive pressure. Routing via the Cape of Good Hope and capacity management policies (blank sailings) have significantly depleted buffer space. Simultaneously, the decision to reduce draft limits at the Panama Canal starting July 1 will directly restrict the payload capacity of USEC-bound sailings.
Prolonged Turnaround Risks: The front-loading trend to avoid PSS/BAF surcharges and tariffs is intensifying pressure on the port system. Cargo rollover risks and empty container shortages at Asian export ports have become tangible operational concerns demanding attention.
US Customs Policy Volatility: IEEPA refunds via the CAPE system may require more time due to legal snags from the DOJ. Concurrently, the direction toward tightening Rules of Origin (ROO) in USMCA and proposed Section 301 tariff adjustments are posing new Cost of Goods Sold (COGS) challenges for importers.
Recommendations from Phaata
To maintain supply chain stability and optimize cash flow, import-export and documentation departments should consider implementing the following solution sets:
Booking and Transport Route Management Operations:
-
Extend Lead Times: It is recommended that documentation departments proactively engage with transport partners to secure bookings 3 to 4 weeks in advance for North America routes and 4 to 5 weeks for Europe routes.
-
Flexible Budgets for Premium Services: For essential raw materials tied to production or finished goods with strict timeline requirements, businesses may consider approving higher FAK rates or utilizing Premium service levels. This is a secure solution to guarantee loading space and prioritize empty container releases.
-
Contingency Plans for the US East Coast: For USEC shipments routed via Panama, factor in the risk of payload reduction due to the draft limit decrease (to 49.5 feet) effective July 1. Shippers should consider splitting shipments or routing via the West Coast (PSW/PNW) combined with Inland Point Intermodal (IPI) rail transport for urgent deliveries.
Customs Compliance and Cost Management Operations:
-
Proactive IEEPA Refund Cash Flow Management: Rather than waiting for the CAPE system to automatically disburse funds for finally liquidated entries, importers should proactively consult their customs brokers and legal advisors. Preparing to file protests at the Court of International Trade (CIT) may be a necessary step to preserve legitimate financial rights.
-
Update Landed Cost Structures: The accounting department must promptly integrate PSS and EBS surcharges (already applied in June with potential adjustments in July) into product cost structures. Simultaneously, budget contingency scenarios should be run for commodity portfolios at risk of Section 301 tariffs (overcapacity) later this summer.
-
Review Rules of Origin (ROO) Documentation: Businesses supplying components into the North American bloc should work closely with manufacturers to re-evaluate their current localization ratios, ensuring readiness to meet the scenario where the US tightens the Regional Value Content (RVC) requirement to 82% for key sectors.
Stay tuned to articles on Phaata.com or Phaata fanpage for rapid and in-depth market updates.
Find Freight Rates Here
Find Logistics Companies Here
See more:
- Decoding Gemini’s Strategy: Reducing North Europe Capacity While Expanding Its Mediterranean Presence
- U.S. Container Imports Declined 5.1% in April 2026
- Hapag-Lloyd Introduces Peak Season Surcharge (PSS) for Shipments to Australia
- International Shipping and Logistics Market Update Week 23/2026 | Phaata
- CMA CGM Hikes FAK Rates from the Indian Subcontinent to Latin America, Europe, and North Africa
- Q1 2026 Report: North American East Coast Ports Gain Market Share Despite Throughput Decline
- Container Freight Rates on Asia–U.S. Trades Surge as Importers Rush Shipments Ahead of New Tariff Measures
- Hapag-Lloyd Discontinues CCM Service Connecting Mexico and Central America from July 2026
- COSCO Orders Four LNG Carriers Worth USD 953 Million to Expand LNG Fleet
- COSCO schedules: Vietnam - North America in Jun 2026
- COSCO updates Vietnam-Intra Asia sailing schedules in Jun 2026
- COSCO updates Vietnam-North Europe sailing schedules in Jun 2026
- SITC updates Vietnam-Intra Asia sailing schedules in Jun 2026
Source: Phaata - Vietnam's First International Logistics Marketplace
► Find Better Freight Rates & Logistics Service Providers!


Featured News
- Hapag-Lloyd applies Peak Season Surcharge from East Asia to USA and Canada
- The world\'s largest container ships MSC Irina and MSC Loreto floated
- MSC (Mediterranean Shipping Company) - The world\'s leading container shipping lines
- Information you need to know about Maersk Line
- Top 10 export and import goods between Vietnam - Philippines in the first 5 months of 2020

 Market News
See more
_-_Copy_-_Copy.webp)

.webp)


 HOT PROMO
See more
187
 FCL
FCL
 20 Days
 Freight cost

N.B.L INTERNATIONAL TRANSPORT CO., LTD
1013
FCL
21 Days
Freight cost
MG LOGISTICS JSC
2791
FCL
28 Days
Freight cost

CÔNG TY TRÁCH NHIỆM HỮU HẠN DT LOGISTICS (VN)
3415
FCL
28 Days
Freight cost

Công Ty TNHH Quanterm Logistics Vietnam
2956
FCL
33 Days
Freight cost

CÔNG TY TNHH TIẾP VẬN TOÀN CẦU KM
Why do thousands of businesses trust Phaata?
USERS/MONTH
LOGISTICS COMPANIES
REQUEST FOR QUOTEŚ
QUOTATIONS
VIETNAM LOGISTICS COMMUNITY
5 Steps to Get the Best Quote
Find a price quickly/Send a RFQ
Compare multiple options
Contact for Further Consultation
Negotiating prices/services
Management & rating
 Freight rates
Sea freight
- FCL
See more
36
7
Days Direct
- ₫529,260 / 20'GP
- ₫3,704,820 / 40'GP
- ₫3,704,820 / 40'HQ
- ₫4,631,025 / 45'HQ

MELODY LOGISTICS COMPANY LIMITED
88
40
Days Transit
- ₫303,557,073 / 40'RF

GIA LINH LOGISTICS SERVICES CO., LTD. (G LINK Logistics)
116
25
Days Transit
- ₫142,900,200 / 20'GP
- ₫195,826,200 / 40'GP
- ₫195,826,200 / 40'HQ

OPL LOGISTICS
160
 164
20
Days Transit
164
20
Days Transit
- ₫29,884,500 / 20'GP
- ₫31,189,500 / 40'GP
- ₫31,189,500 / 40'HQ

CÔNG TY CỔ PHẦN TIẾP VẬN INTERCARGO
Sea freight
- LCL
See more
475
3
Days Direct
- Refund ₫926,205 /cbm

CÔNG TY CỔ PHẦN GIAO NHẬN VẬN TẢI HỒNG SƠN
816
1,639
3
Days Direct
- ₫132,315 /cbm
CÔNG TY TRÁCH NHIỆM HỮU HẠN DT LOGISTICS (VN)
1,753
3
Days Direct
- ₫0 /cbm

CÔNG TY TNHH VẬN TẢI VÀ TIẾP VẬN TOÀN CẦU
3,817
 Air freight
- General cargo
Air freight
- General cargo
See more
1,958
1
Days Direct
- 46,310 ₫/kg
N.B.L INTERNATIONAL TRANSPORT CO., LTD
2,664
1
Days Direct
- 161,424 ₫/kg
CÔNG TY CỔ PHẦN GIAO NHẬN VẬN TẢI HỒNG SƠN
5,536
10
Days Transit
- 264,630 ₫/kg

Phoenix Logistics Vietnam - chi nhánh TP. Hồ Chí Minh (Phoenix International Forwarding Vietnam )
7,223
1
Days Direct
- 185,241 ₫/kg

CÔNG TY TNHH THƯƠNG MẠI VÀ DỊCH VỤ FASTRANS
8,775

 Rail freight
- FCL
Rail freight
- FCL
See more
3,311
5
Days Direct
- ₫44,987,100 / 40'HQ
- ₫44,987,100 / 45'HQ

CÔNG TY TNHH PHƯỚC TÁ
5,087
3
Days Direct
- ₫15,083,910 / 40'HQ

CÔNG TY CỔ PHẦN VẬN TẢI VÀ THƯƠNG MẠI ĐƯỜNG SẮT
15,444
7
Days Direct
- ₫48,956,550 / 20'GP

Công ty TNHH T&M Forwarding
14,214
5
Days Direct
- ₫7,145,010 / 20'GP

ASIAN EXPRESS LINE VIETNAM ( AEL VIET NAM )
9,842
10
Days Direct
- ₫9,262,050 / 20'GP

CÔNG TY CỔ PHẦN LOGISTICS QUỐC TẾ V&T
 Road freight
- FCL
Road freight
- FCL
See more
1,441
4
Day
- ₫5,000,000 / 40'GP

CÔNG TY CỔ PHẦN IGAP
3,978
1
Day
- ₫28,000,000 / 20'GP
- ₫28,000,000 / 40'GP

CÔNG TY TNHH THƯƠNG MẠI DỊCH VỤ VÀ KHO VẬN VIETTEL POST - TTC
105,325
2
Day
- ₫6,500,000 / 40'RF
- ₫6,500,000 / 40'RQ
- ₫6,500,000 / 45'RQ

CÔNG TY CP PROSHIP
 Premium
173,975
1
Day
Premium
173,975
1
Day
- ₫18,997,200 / 20'GP
- ₫18,997,200 / 40'GP

CÔNG TY CỔ PHẦN GIAO NHẬN VẬN TẢI CON ONG
263,587
3
Day
- ₫32,000,000 / 20'GP
- ₫64,000,000 / 40'GP
- ₫64,000,000 / 40'HQ
- ₫64,000,000 / 45'HQ

Công ty Cổ phần phát triển thương mại Thuận Đạt Việt Nam


